
12. Building a Monitor Test Plan (REMOVED since JMeter 3.2)
In this section, you will learn how to create a Test Plan to monitor webservers. Monitors are useful for a stress testing and system management. Used with stress testing, the monitor provides additional information about server performance. It also makes it easier to see the relationship between server performance and response time on the client side. As a system administration tool, the monitor provides an easy way to monitor multiple servers from one console. The monitor was designed to work with the status servlet in Tomcat 5. In theory, any servlet container that supports JMX (Java Management Extension) can port the status servlet to provide the same information.
For those who want to use the monitor with other servlet or EJB containers, Tomcat's status servlet should work with other containers for the memory statistics without any modifications. To get thread information, you will need to change the MBeanServer lookup to retrieve the correct MBeans.
12.1 Adding A Server
The first step is to add a Thread Group element. The Thread Group tells JMeter the number of threads you want. Always use 1, since we are using JMeter as a monitor. This is very important for those not familiar with server monitors. As a general rule, using multiple threads for a single server is bad and can create significant stress.
Go ahead and add the ThreadGroup element by first selecting the Test Plan, clicking your right mouse button to get the menu, and then select .
You should now see the Thread Group element under Test Plan. If you do not see the element, "expand" the Test Plan tree by clicking on the Test Plan element.
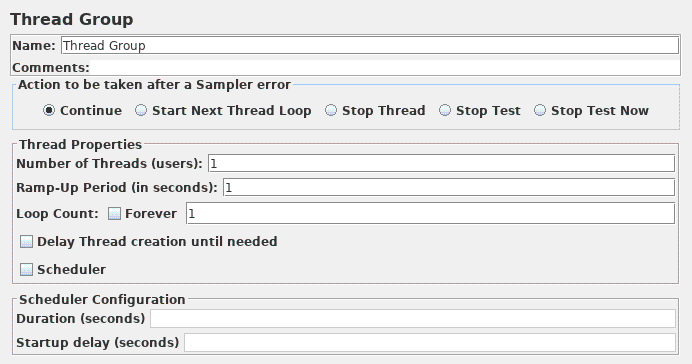
Change the loop count to forever (or some large number) so that enough samples are generated.
12.2 HTTP Auth Manager
Add the HTTP Authorization Manager to the Thread Group element (). Enter the username and password for your webserver.
- leave the base URL blank
- enter the username
- enter the password
12.3 Adding HTTP Request
Add the HTTP Request to the Thread Group element (). Then, select the HTTP Request element in the tree and edit the following properties):
- Change the Name field to "Server Status".
- Enter the IP address or Hostname
- Enter the port number
- Set the Path field to "/manager/status" if you're using Tomcat.
- Add a request parameter named "XML" in uppercase. Give it a value of "true" in lowercase.
- Check "Use as Monitor" at the bottom of the sampler
12.4 Adding Constant Timer
Add a timer to this thread group (). Enter 5000 milliseconds in the "Thread Delay" box. In general, using intervals shorter than 5 seconds will add stress to your server. Find out what is an acceptable interval before you deploy the monitor in your production environment.
12.5 Adding a Listener to Store the Results
If you want to save the raw results from the server, add a simple data Listener. If you want to save the calculated statistics, enter a filename in the listener. If you want to save both the raw data and statistics, make sure you use different filenames.
Select the thread group element and add a Simple Data Writer listener (). Next, you need to specify a directory and filename of the output file. You can either type it into the filename field, or select the Browse button and browse to a directory and then enter a filename.
12.6 Adding Monitor Results
Add the Listener by selecting the test plan element ().
By default, the Listener will select the results from the first connector in the sample response. The Connector prefix field can be used to select a different connector. If specified, the Listener will choose the first connector which matches the prefix. If no match is found, then the first connector is selected.
There are two tabs in the monitor results listener. The first is the "Health", which displays the status of the last sample the monitor received. The second tab is "Performance", which shows a historical view of the server's performance.

A quick note about how health is calculated. Typically, a server will crash if it runs out of memory, or reached the maximum number of threads. In the case of Tomcat 5, once the threads are maxed out, requests are placed in a queue until a thread is available. The relative importance of threads vary between containers, so the current implementation uses 50/50 to be conservative. A container that is more efficient with thread management might not see any performance degradation, but the used memory definitely will show an impact.

The performance graph shows four different lines. The free memory line shows how much free memory is left in the current allocated block. Tomcat 5 returns the maximum memory, but it is not graphed. In a well tuned environment, the server should never reach the maximum memory.
Note the graph has captions on both sides of the graph. On the left is percent and the right is dead/healthy. If the memory line spikes up and down rapidly, it could indicate memory thrashing. In those situations, it is a good idea to profile the application with Borland OptimizeIt or JProbe. What you want to see is a regular pattern for load, memory and threads. Any erratic behavior usually indicates poor performance or a bug of some sort.