
22. Hints and Tips
This section is a collection of various hints and tips that have been suggested by various questions on the JMeter User list. If you don't find what you are looking for here, please check the JMeter Wiki. Also, try search the JMeter User list; someone may well have already provided a solution.
22.1 Passing variables between threads
JMeter variables have thread scope. This is deliberate, so that threads can act independently. However sometimes there is a need to pass variables between different threads, in the same or different Thread Groups.
One way to do this is to use a property instead. Properties are shared between all JMeter threads, so if one thread sets a property, another thread can read the updated value.
If there is a lot of information that needs to be passed between threads, then consider using a file. For example you could use the Save Responses to a file listener or perhaps a BeanShell PostProcessor in one thread, and read the file using the HTTP Sampler "file:" protocol, and extract the information using a PostProcessor or BeanShell element.
If you can derive the data before starting the test, then it may well be better to store it in a file, read it using CSV Dataset.
22.2 Enabling Debug logging
Most test elements include debug logging. If running a test plan from the GUI, select the test element and use the Help Menu to enable or disable logging. The Help Menu also has an option to display the GUI and test element class names. You can use these to determine the correct property setting to change the logging level.
It is sometimes very useful to see Log messages to debug dynamic scripting languages like BeanShell or Apache Groovy used in JMeter. You can view log messages directly in JMeter GUI, to do so:
- use menu , a log console will appear at the bottom of the interface
- Or click on the Warning icon in the upper right corner of GUI
jmeter.loggerpanel.display=trueTo avoid using too much memory, this components limits the number of characters used by this panel:
jmeter.loggerpanel.maxlength=80000
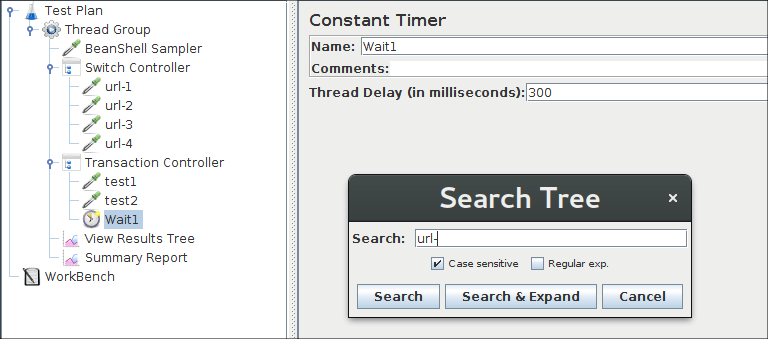
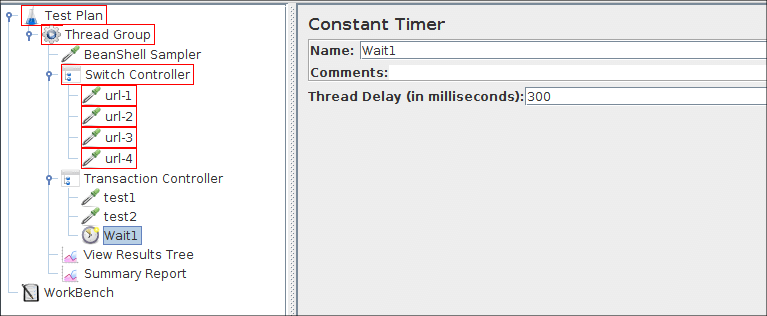
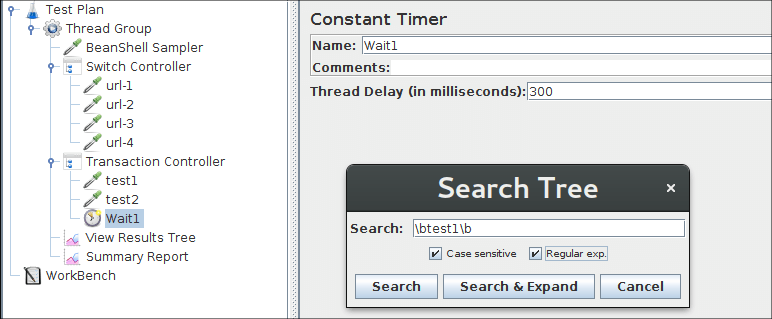
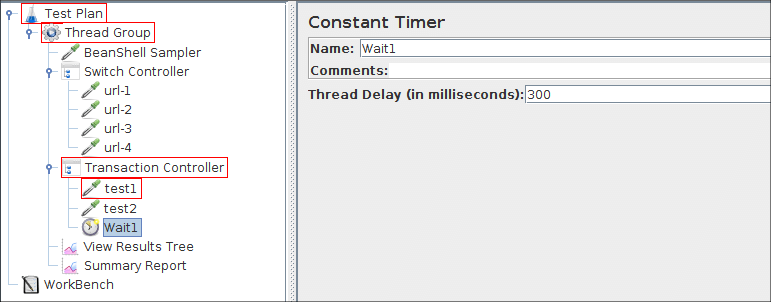
22.3 Searching
It is sometimes hard to find in a Test Plan tree and elements using a variable or containing a certain URL or parameter. A new feature is now available since 2.6, you can access it in Menu Search. It provides search with following options:
- Case sensitive
- Makes search case sensitive
- Regular exp.
- Is text to search a regexp, if so Regexp will be searched in Tree of components, example "\btest\b" will match any component that contains test in searchable elements of the component
22.4 JMeter and a HiDPI screen
With Java version 9 and up, the HiDPI (High Dot Per Inch) screens are supported.
You can define the Java property sun.java2d.uiScale to change the scale of JMeter. The value can be an integer or percentage value.
For example, on Linux, with x2 factor (200%):
    $ export JVM_ARGS="-Dsun.java2d.uiScale=200%"
    $ ./bin/jmeter
With Java version 8, the HiDPI (High Dot Per Inch) screens aren't supported in the Swing API. You can improve the JMeter's display on HiDPI screen by changing some properties:
- jmeter.hidpi.mode
- set to true to activate a 'pseudo'-hidpi mode allowing to increase size of some UI elements
- jmeter.hidpi.scale.factor
- set to 2.0 to scale the size of some UI elements
- jmeter.toolbar.icons.size
- with these values: 22x22 (default size), 32x32 or 48x48 (Suggested value for HiDPI)
- jmeter.tree.icons.size
- with these values: 19x19 (default size), 24x24, 32x32 (Suggested value for HiDPI) or 48x48
Additionally you can increase the font size of the text areas in some elements like JSR223 sampler by changing theses properties:
- jsyntaxtextarea.font.family
- set to Hack to activate and to change the font and their size
- jsyntaxtextarea.font.size
- set to a greater value, like 28 (Suggested value for HiDPI)
- JMeter tree nodes
- Icons in the toolbar
- Tables content
- Font size into text areas
22.5 Autosave process configuration
Since JMeter 3.0, JMeter automatically saves up to ten backups of every saved jmx files. When enabled, just before the jmx file is saved, it will be backed up to the ${JMETER_HOME}/backups subfolder. Backup files are named after the saved jmx file and assigned a version number that is automatically incremented, ex: test-plan-000001.jmx, test-plan-000002.jmx, test-plan-000003.jmx, etc. To control auto-backup, add the following properties to user.properties.
- backup_on_save
-
To enable/disable auto-backup, set the following property to true/false (default is true):
jmeter.gui.action.save.backup_on_save=false
- backup_directory
-
The backup directory can also be set to a different location. Setting the jmeter.gui.action.save.backup_directory property
to the path of the desired directory
will cause backup files to be stored inside instead of the ${JMETER_HOME}/backups folder. If the specified directory does not exist
it will be created. Leaving this property unset will cause the ${JMETER_HOME}/backups folder to be used.
jmeter.gui.action.save.backup_directory=/path/to/backups/dir
- keep_backup_max_hours
-
You can also configure the maximum time (in hours) that backup files should be preserved since the most recent save time.
By default a zero expiration time is set which instructs JMeter to preserve backup files for ever.
Use the following property to control max preservation time:
jmeter.gui.action.save.keep_backup_max_hours=0
- keep_backup_max_count
-
You can set the maximum number of backup files that should be preserved. By default 10 backups will be kept.
Setting this to zero will cause the backups to never being deleted (unless keep_backup_max_hours is set to a non null value)
Maximum backup files selection is processed after time expiration selection, so even if you set one year as the expiry time,
only the keep_backup_max_count most recent backups files will be kept.
jmeter.gui.action.save.keep_backup_max_count=10
22.5 Adding Elements with Hotkeys
When you do intense scripting with JMeter, there is a way to add elements to test plan quickly with keyboard shortcuts. Default bindings are:
- Ctrl + 0
- Thread Group
- Ctrl + 1
- HTTP Request
- Ctrl + 2
- Regular Expression Extractor
- Ctrl + 3
- Response Assertion
- Ctrl + 4
- Constant Timer
- Ctrl + 5
- Test Action
- Ctrl + 6
- JSR223 PostProcessor
- Ctrl + 7
- JSR223 PreProcessor
- Ctrl + 8
- Debug Sampler
- Ctrl + 9
- View Results Tree
To change these binding, please find "gui.quick_*" properties within jmeter.properties file as example, it is recommended to put overrides for them into user.properties file.
22.6 Browser renderer is not displaying in View Results Tree
If you're using OpenJDK or Oracle Java version higher than 8, you'll notice that Browser Renderer is not displayed. This is because JavaFX is not embedded. In order to have this element you need to follow the below procedure.
-
Follow this documentation to install Java FX for your OS and Java version.
If you don't want to read it, here are the necessary steps:- Go to Gluon website and download the runtime for your Java version and OS
- Unzip it
-
Then configure a variable pointing to lib folder:
Linux/MacOSX:
export PATH_TO_FX=path/to/javafx-sdk-XX/lib
Windows:
set PATH_TO_FX=path/to/javafx-sdk-XX/lib
-
Then open bin/jmeter file for Linux/MacOSX, bin/jmeter.bat for Windows, find JAVA9_OPTS variable and add:
Linux/MacOSX:
--module-path $PATH_TO_FX --add-modules javafx.web,javafx.swing
Windows:
--module-path %PATH_TO_FX% --add-modules javafx.web,javafx.swing